Key Factors Report Available Files
| Track | Price | Thu 25th | Fri 26th | Sat 27th | Sun 28th | Mon 29th | Tue 30th | Wed 1st |
|---|---|---|---|---|---|---|---|---|
| Aqueduct | $4.00 | - | - | - | - | |||
| Belterra Park | $4.00 | - | - | - | - | |||
| Churchill Downs | $4.00 | - | - | - | - | - | ||
| Charlestown Races & Slots | $4.00 | - | - | - | - | |||
| Evangeline Downs | $4.00 | - | - | - | - | |||
| Finger Lakes | $4.00 | - | - | - | - | - | ||
| Fonner Park | $4.00 | - | - | - | - | - | ||
| Golden Gate Fields | $4.00 | - | - | - | - | - | ||
| Gulfstream Park | $4.00 | - | - | - | - | |||
| Hawthorne Race Course | $4.00 | - | - | - | - | - | ||
| Hastings Park | $4.00 | - | - | - | - | - | - | |
| Indiana Downs | $4.00 | - | - | - | - | - | ||
| Keeneland | $4.00 | - | - | - | - | - | ||
| Laurel Park | $4.00 | - | - | - | - | - | ||
| Lone Star Park | $4.00 | - | - | - | - | |||
| Mountaineer Track & Resort | $4.00 | - | - | - | - | - | - | |
| Oaklawn Park | $4.00 | - | - | - | - | - | ||
| Parx Racing | $4.00 | - | - | - | - | - | ||
| Santa Anita | $4.00 | - | - | - | - | - | ||
| Sunray Park | $4.00 | - | - | - | - | - | ||
| Tampa Bay Downs | $4.00 | - | - | - | - | - | ||
| Thistledown | $4.00 | - | - | - | - | |||
| Turf Paradise | $4.00 | - | - | - | ||||
| Woodbine | $4.00 | - | - | - | - | - | - |
Make More Profitable and Informed Betting Decisions

Horse racing handicapping is a game where those who have the best information and know how to interpret it will win more often and bigger payouts than those without that information. However, it can take professional handicappers a lifetime to learn how to read past performance to be able to quickly identify the key factors that make a horse win a race.
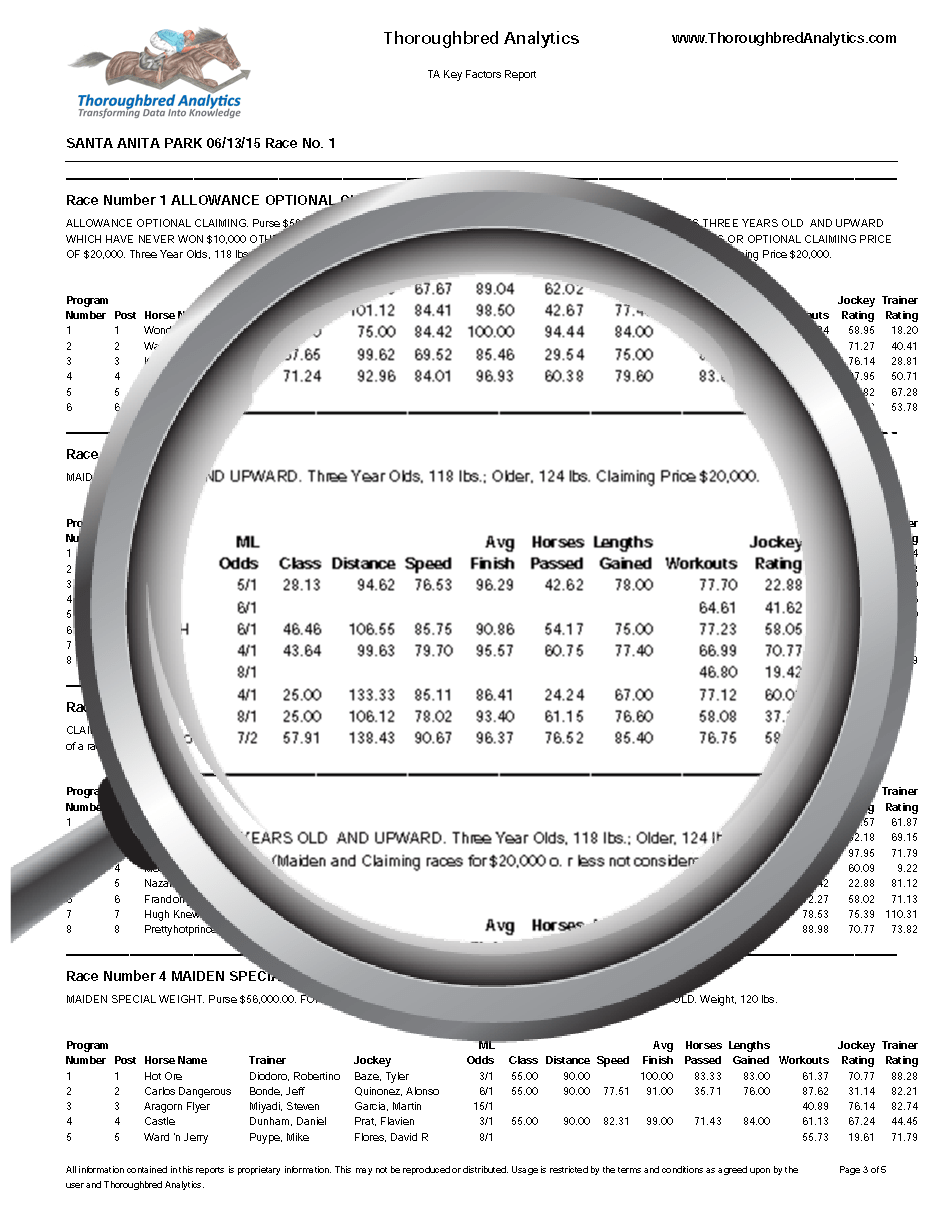
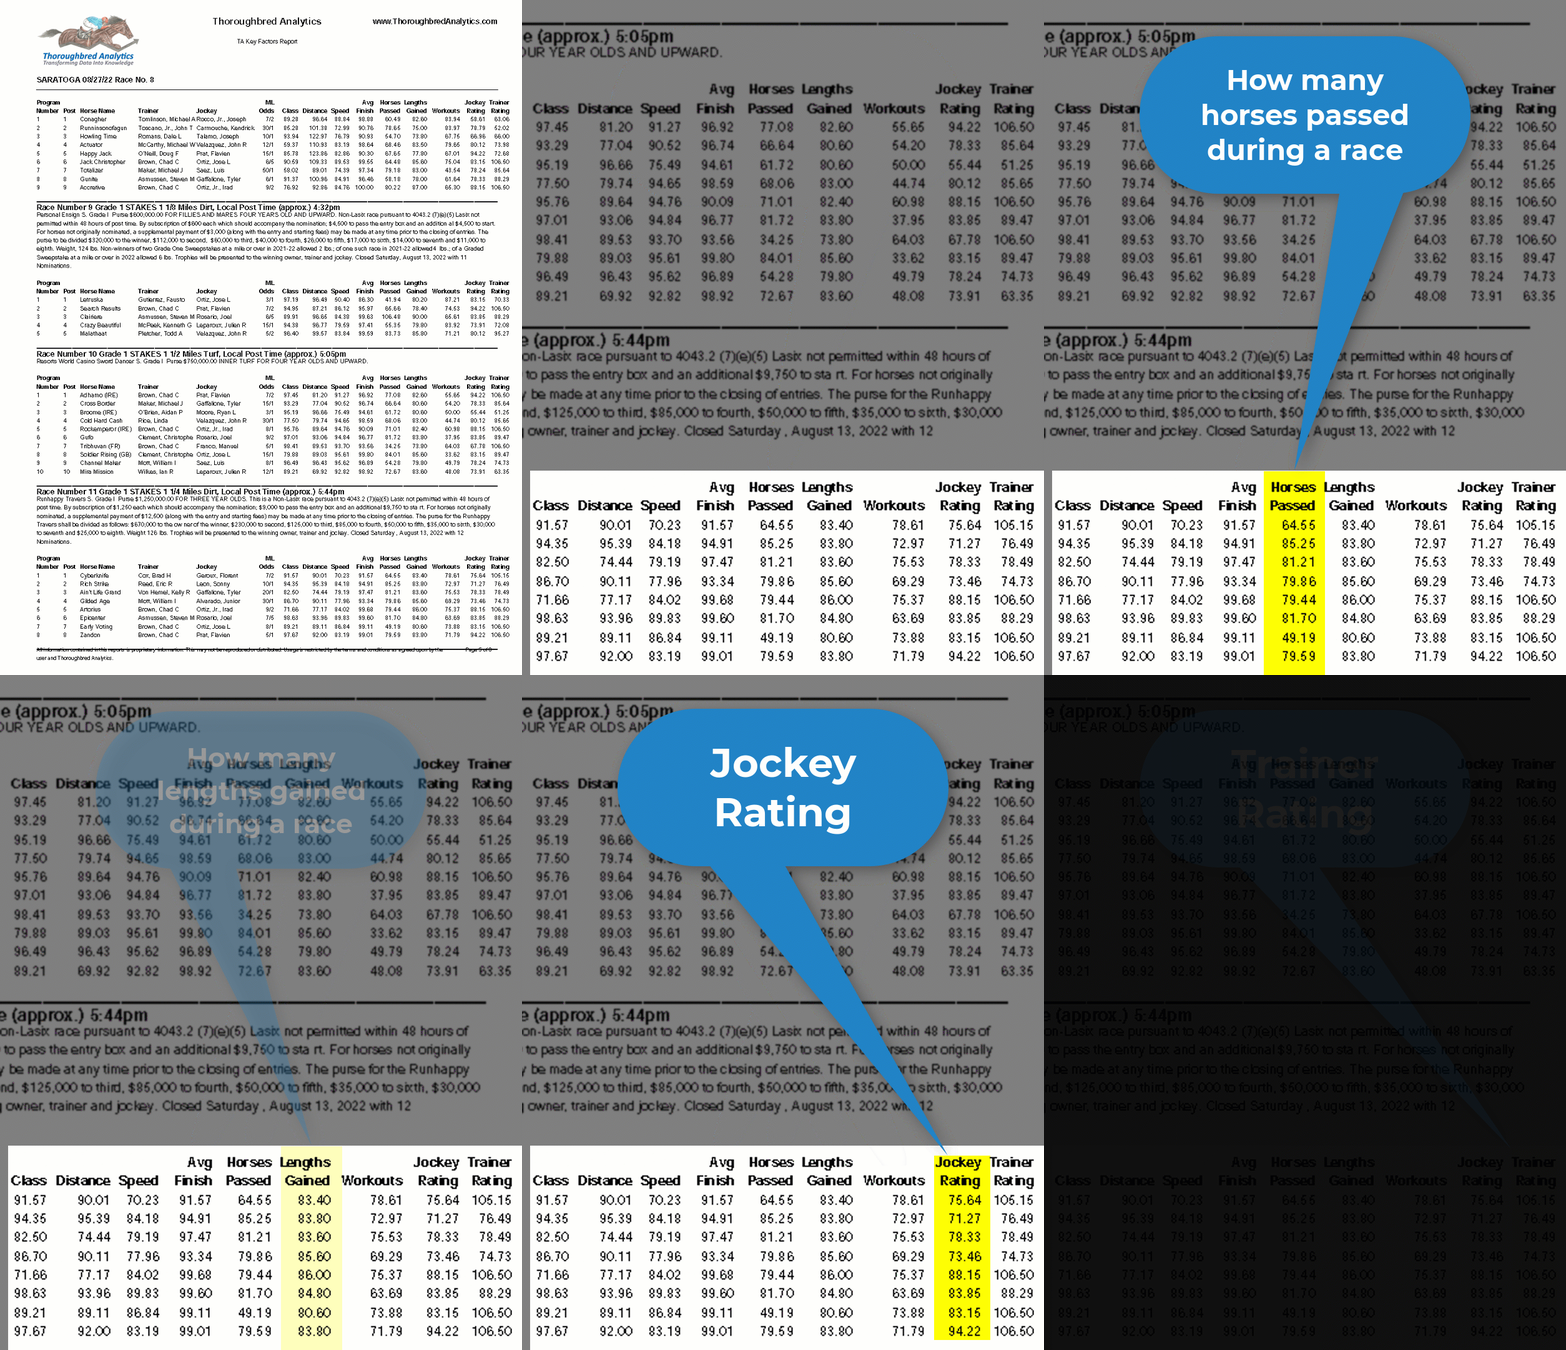
The Key Factors Report does this work for you by using Thoroughbred Analytic's proprietary tools to identify those key factors most important in each race and then you'll get an easy to use rating for each horse for each of these winning key factors.
You can now confidently see which horses in each race have the best chances of winning based on each of these key factors and by how much. With this new powerful information you will clearly see those horses that can win and will now have more confidence to determine the best bets and wagering decisions in each race.
Handicapper's Who Love Key Factors
"Although I love your service, I'm no examplar for horseplayers seeking a fortune. I love the horses, but I'm not a heavy better. I like to put a little money on my pick and enjoy a casual afternoon at Kentucky Downs, live or at the OTB"
Phil M.
"Some success today. I hit the pick 4 at CD $210.00 and went 8 out of 10 for the win at Chuchill Downs."
Denny C.
When To Use
Make More Profitable Betting Decisions
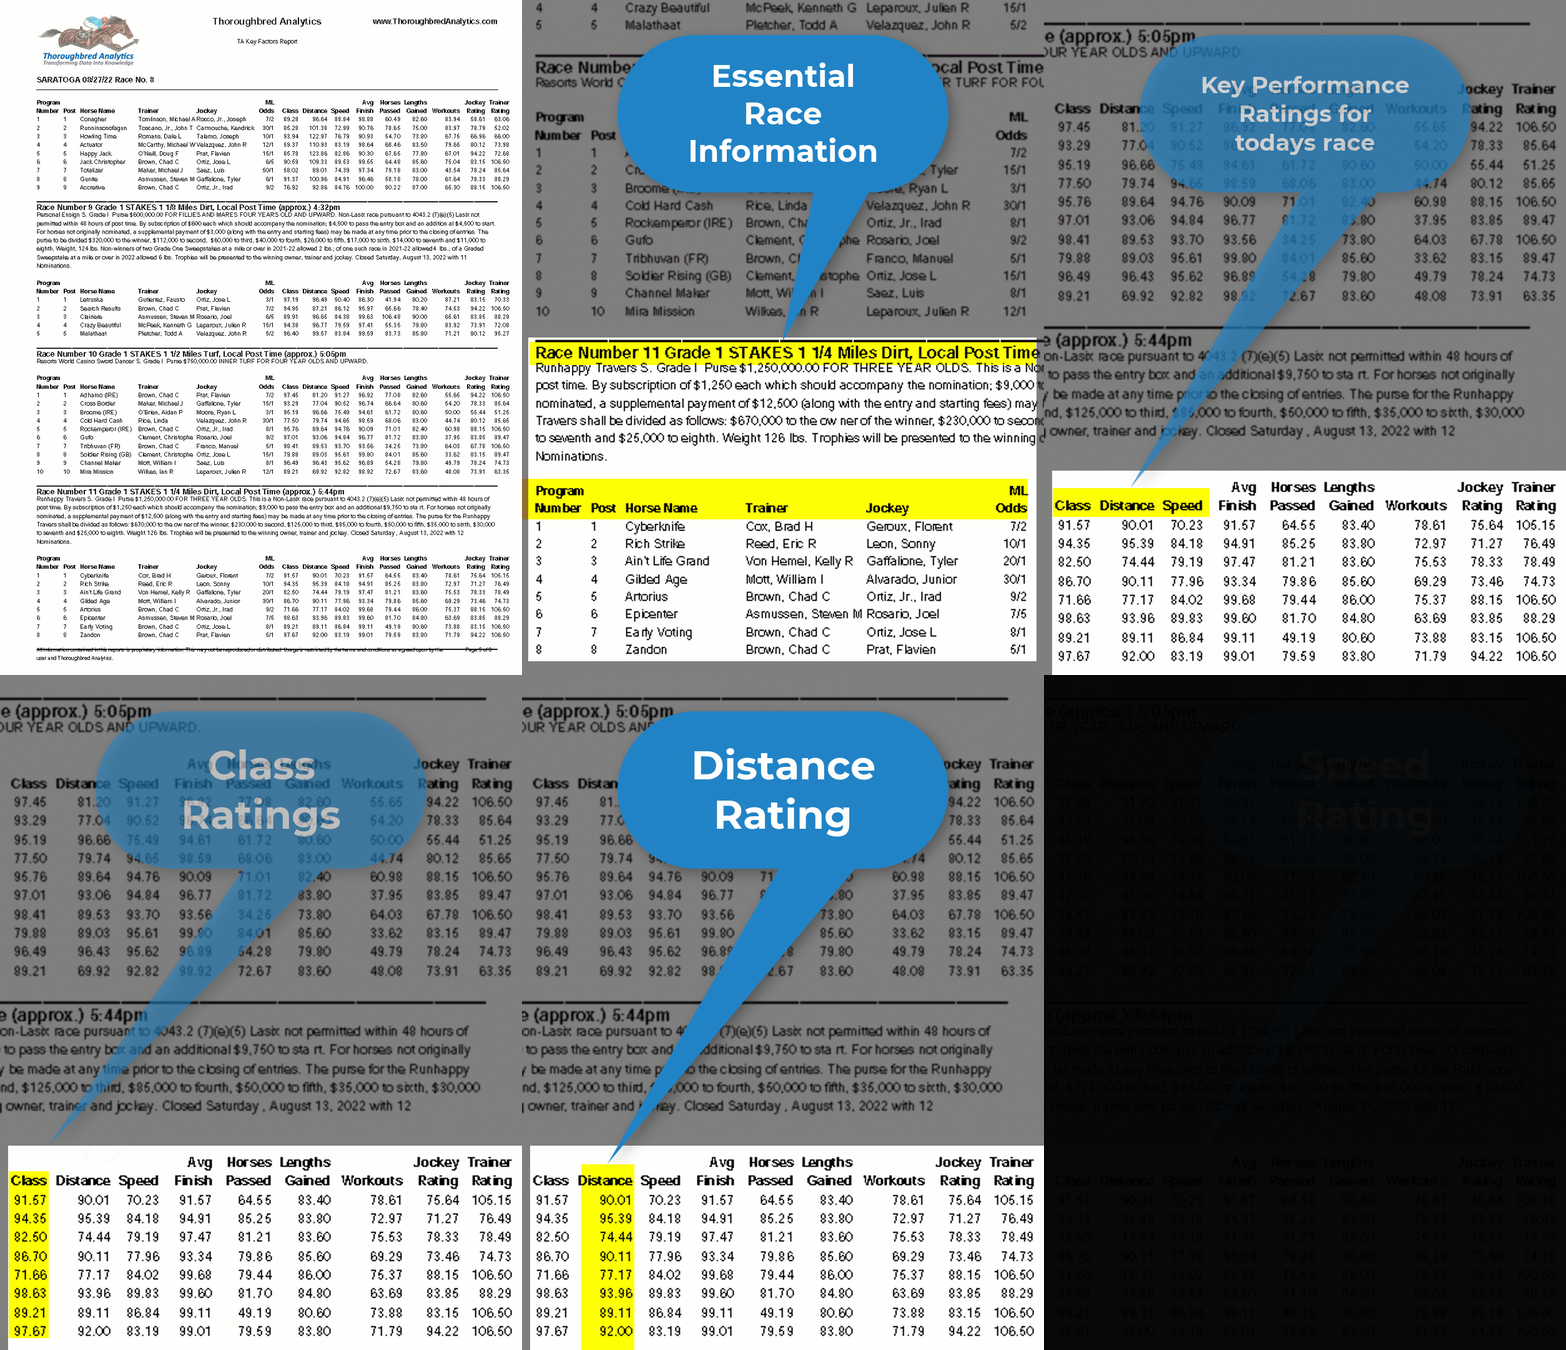
Easily uncover the real contenders and false favorites in each horse race.
Quickly discover which horses and connections have the ability to win
About Thoroughbred Analytics

Thoroughbred Analytics is the industry leading provider of data-driven handicapping reports and horse racing statistics for horse racing enthusiasts and professionals, from the beginner to the most advanced. Our reports are produced individually for each race and every thoroughbred track in North America using detailed data and our advanced proprietary handicapping software.


