

How To Use Today's Racing Digest Products
How To Handicap Horses With Fractional Charting
How to Handicap With Fractional Charting
Winning Has Never Been Easier
 “It is not how fast the horse runs that is important. It is how the horse runs fast.” Betting the highest speed figure will ultimately give you a flat bet loss. Often times the top speed figure horse is not suited for the pace match up of the race. This is where pace handicapping and Fractional Charting can help.
Unlike traditional past performances, Fractional Charting makes it easy to understand the running styles and pace figures of each horse along with the probable pace shape of the race. With Fractional Charting you will be able to quickly visualize how the race may be run and identify which horses can or cannot compete in today’s race.
The Digest's "paper race," the daily Fractional Chart page is a projection of today's race using a representative race (chosen by our expert staff) from each horse's past performances. The Fractional Chart page has always been one of the publication's most popular features since it aids the handicapper in visualizing how today's heat will unfold, displaying likely frontrunners and projected early fractions, as well as the swiftest closers and projected final times. The par (average winning time for that class) for each race is also listed.
First-time Lasix users, supplemental entries and horses adding or removing blinkers are also noted on this page.
There are a myriad of uses for the Fractional Charting and in general, any horse charting within one second (five lengths) of the chart-topper should be considered capable of winning. In Maiden races, if no horse charts close to par time for the level, then that's the time to give the new faces (first-time starters) a second look. Handicappers that find themselves in a slump, might be wise to get back to the basics and a good way to do that is to only play horses that do very well in the Fractional Charting.
Overview of Fractional Charting
“It is not how fast the horse runs that is important, but how the horse runs fast.”
If you bet the highest speed figure horse to win in every race, you will probably achieve 30 to 35 percent winners and a flat bet loss. The loss means that the public is very much in tune with speed handicapping which, of course, drives mutuel payoffs down. The percentage means that roughly two thirds of the races are won by horses that are not the top speed figure horses. Some of this can be explained by the top speed horses not being suited to the distance or surface, going off form or being out classed. By far the main reason for this phenomenon, however, is that the top speed figure horse is not suited to the pace match-up of the race. It has been said: “It is not how fast the horse runs that is important, but how the horse runs fast.”
Effective pace handicapping requires that you know at least 3 things: 1) the running styles of the horses; 2) the pace figures of the horses; 3) the probable pace shape of the race.
Unlike traditional past performances that can often be difficult to understand pace scenarios in today's race conditions, Fractional Charting simplifies the process by converting those raw past performance times into projected times each horse is expected to run at each point of call in today's race. With these new projected running lines you can easily see the running style and pace figures for each horse and how they compare to the other horses in the field giving you the probable pace shape of the race.
How To Read Fractional Charting

How To Use Fractional Charting
Fractional Charting is a great tool to help you envision how a race will unfold while determining which runners might have a pace advantage or should be able to successfully step up in class. Unlike traditional past performances, Fractional Charting includes projected interior and final times based on a par-time-by-class standard that takes into account the subtle differences among race tracks across the country. Since the times have been normalized to reflect today's race conditions it is now easier to compare past performances even if the horse is moving tracks, distances, surface and/or class.
Each race horse is ordered by the fastest final time at the top. Par for the class is also listed in bold type above the race. This is useful in determining which horses are a strong fit for the class. The fastest times at each point of call are underlined so you can quickly see who is on the lead at anytime throughout the race and who may have a pace advantage. The fastest finish times are also listed. These times take special significance in turf races where closing kicks take on added importance. This allows you to quickly see potential pace scenarios and race shapes take place before the race even begins.
Pay special attention to those horses that have the fastest final times. Also when looking for contenders consider any horse charting within 5 lengths (one second) of the top horses final time.
Easily Visualize How the Race Will Unfold Identifying Pace Scenarios and Race Shapes

With Fractional Charting's projected times for each point of call throughout the entire race you can quickly identify pace scenarios that would otherwise go unnoticed. Unlike traditional handicapping products that require years of experience to learn to identify pace scenarios and race shapes Fractional Charting does the work for you by adjusting the raw past performance times to reflect today's race conditions and then ranking the horses by the order of finish. The times shown at each point of call are expected times each horse should run in today's race. The fastest time at each point of call is underlined making it easy to quickly identify the leader at each point in the race.
The image to the right shows you the different features included in each Fractional Charting. Download a pdf of the image.
Understand the Average Winning Times for Today's Races
 Each race includes the Average Winning Times for Today's Race at the top of the Fractional Charting. These average times take into account today's race class level, track, distance, and surface. The average times have been compiled and regularly updated in our extensive database for over 45 years. These are the most accurate average times available anywhere.
You can use the Average Times to help get a better understanding of what is expected from the horses in this race at each point of call. By comparing the Average Times to the horses expected times you can quickly see which horses can or cannot compete at today's race level. This makes it easy to begin to narrow down the field of contenders. If none of the horses can compete at today's race level then chaos may ensue opening the race up for potential long-shots or unlikely favorites.
Single Out False Favorites, Contenders And Overlays
 With Fractional Charting's simple to use layout you can easily visualize how the race will unfold to uncover potential speed duels, unexpected late runners, likely front runners and the swiftest closers. Each race horse is ordered by the fastest final times. Pay special attention to those horses that have the fastest final times. Horses that are only 1 – 3 lengths back in the Fractional Charting often offer good value on the tote board which can lead to bigger payouts. The best way to quickly uncover hidden value and identify horses capable of winning in today’s race is to identify any horse charting within one second (five lengths) of the chart-topper. These horses that are within one second of the fastest time should be considered capable of winning in today’s race.
In the example to the left on April 25th at Gulfstream in the 3rd race we see the potential for a speed duel between Chico Grande, Galardonado and Face Of Winner. All early projected fractions are within a few lengths of each other. Looking at Secret Chance we see he has the fastest closing time of 25.2 and a final time of 1:12.6. In this race Secret Chance was overlooked in the betting due to the early speed of the favorites. With Fractional Charting you can now easily uncover the potential for favorites to get into a speed duel and if that happens who has the best chance of winning the race. When looking at the race replay and results you will see a speed duel is exactly what happened and Secret Chance dug in at the stretch and surged for the win paying $20.80 on a $2 win bet.
An Insightful Tool That Gives You a New Way To Look At Each Race
 If you bet the highest speed figure horse to win in every race, you will probably achieve 30 to 35 percent winners and a flat bet loss. The loss means that the public is very much in tune with speed handicapping which, of course, drives mutuel payoffs down. The percentage means that roughly two thirds of the races are won by horses that are not the top speed figure horses. Some of this can be explained by the top speed horses not being suited to the distance or surface, going off form or being out classed. By far the main reason for this phenomenon, however, is that the top speed figure horse is not suited to the pace match-up of the race. It has been said: “It is not how fast the horse runs that is important, but how the horse runs fast.”
Effective pace handicapping requires that you know at least 3 things: 1) the running styles of the horses; 2) the pace figures of the horses; 3) the probable pace shape of the race.
Fractional Charting gives you all three of these things. By adding Fractional Charting into your regular handicapping process you will be taking the next step beyond just looking at speed giving you an edge by being able to quickly and more accurately identify false favorites, hidden value, potential pace scenarios, likely frontrunners, projected early fractions, the swiftest closers, projected final times and more.
In Race 5 and Churchill Downs on May 7, 2015 (included in the image on the left with comments) is a good example of how the shape of a race can be determined once you understand the running style of each horse and the average times expected at this level. Both of these tasks are easy using Fractional Charting as is shown in the example on the left.
Determine Which Horses Have a Pace Advantage
 Different running styles often determine the pace of the race. Often times one particular running style will do better in one type of race versus another. Additionally, if there are too many front runners entered it may lead to a speed duel where the likely favorite may run out of steam and allow an overlooked pace presser, mid pack runner or closer to come from behind to win the race. Fractional Charting makes it easy to identify likely front runners, the swiftest closers and determine which horses may have a pace advantage in each race.
Through projected early fractions you can quickly see which horses will be on or near the lead and which horses will be strictly closers. The best way to determine which runners might have a pace advantage is to pay special attention to those horses that have their pace numbers underlined. These underlined times are the fastest early times in the race and these horses may have a pace advantage. These underlined times also can help you see if a horse can set an uncontested pace or finish better than the majority of the field.
Fractional Charting shows you the projected last fractions and finish times of each horse allowing you to easily identify those horses that have the ability to produce a fast closing kick. These final times take on a special significance in turf races where closing kicks take on added importance.
In the Turf Race, Fractional Charting example in the image above you can see SonnyandPally has the fastest late fraction of 22.9 (far right hand column) and Call Wil has the 2nd fastest late fraction of 23.5 indicating these two horses have the ability to produce a fast closing kick. The results of the race are shown below the Fractional Charting and a $2 Superfecta bet on the top 4 charting horses would have paid $669.
Fractional Charting and the Exotic Wagers
 Fractional Charting is a great tool for helping you play the pick 4, pick 6, trifectas, and superfectas. Each race horse is ordered by the fastest final times which makes the contenders and overlays easy to spot helping you make the best wagering decisions.
As can be seen in the Fractional Charting shown on the right the top 4 runners (Mel Beach was scratched) came in the order listed on the Fractional Charting. A $2 Superfecta Bet using the top 4 runners listed on the Fractional Charting for this race would have earned a $7,357.40 payout.
How Fractional Charting Is Different
3/04/fractionalchartinghowtousesHow do you compare a horse's past performance and translate that to today's race when they are moving to a different track, distance, surface, and/or class? Then try and take that information and compare it with all the other horses in the race which may also be moving tracks, distances and surfaces and class. Its' virtually impossible without normalizing those past performances to today's race track distance, surface and class by converting that data utilizing very specific and accurate track pars and variants. Fractional Charting is a new easy way to visual the pace of the race regardless of what track, surface, distance, and class the horses have run prior to today's race.
Plotting and studying times from previous performances is a basic part of handicapping. Professional handicappers have been making these types of projected numbers for years to help them uncover hidden value, overlooked long-shots, potential pace scenarios and race shapes. Unlike traditional past performances, Fractional Charting's projected datalines makes it easy to visualize how the race will unfold by taking the guess work out of trying to estimate pace scenarios and determining which horses will benefit from it. No other handicapping product gives you this type of insightful information.
Projected Running Lines
Fractional Charting is the only handicapping product that gives you projected interior, final and closing times along with an average expected time for each race making it easier to compare how a horse is expected to perform in today's race. All of the times listed in Fractional Charting are projections of how each horse will likely perform in today's race.
For over 45 years Fractional Charting has been fine tuning our par-time-by-class standard that takes into account the subtle differences among race tracks across the country. Unlike other products that give you the actual times the horse ran at each point of call we have simplified the process of comparing past performances by providing times that have already been normalized to reflect today’s race conditions. This makes it easier to compare past performances even if the horses are moving tracks, distances, surface and/or class.
The how to use image to the right gives you an overview of the different features included in every Fractional Charting.
Download the printable how to use guide
Proven Methodology to Create Fractional Charting
Through the use of sophisticated algorithms and a robust database utilizing proprietary track pars, track variants and class levels Fractional Charting has done the number crunching for you giving you more time to spend on handicapping.
Using proven strategies and methods, Fractional Charting's projected numbers are created using our proprietary algorithms and a powerful database which allows us to generate the most accurate projected times possible. The process begins with our expert handicappers reviewing every past performance for each horse entered in the race. They then select the most relevant past performance for today's race taking into consideration the horses performance throughout the race, past race tracks, distances, surface, performance cycles, changes in equipment, riders, and trainers and any other factor that might be relevant in the horses performance in today's race. Once the past performance is selected it will then be normalized by our databases to reflect projected running times for today's race conditions. This is done using our proven par-time-by-class standard which takes into account track pars, track variants and class levels that we have established for every track we cover. The results are projected times for each horse which have been "normalized" to today's race conditions taking into account the subtle differences among race tracks across the country.
How To Win With Fractional Charting
With Fractional Charting, virtually any race-goer can approach a day at the race track, or Off Track Betting facility with greater confidence. Whether you are a new or experienced handicapper Fractional Charting simple layout and insightful information is a new easier way to visual and understand the pace and shape of the race. You now have access to the same type of inside information professional handicappers have been using for years. Unlike traditional past performances that show the actual times of each race, Fractional Charting, based on a representative race (chosen by our expert staff) shows you a projection of how each horse will perform in today's races. This makes it easier to see likely pace scenarios, front runners, potential speed duels, the swiftest closers and possible long-shot threats.
Fractional Charting has been created using very sophisticated algorithms which have been refined and proven for over 40 years of experience and our robust database normalizes the raw data to project how the horse will run in today's new race conditions. By normalizing the raw past performances you now can easily see how each past performance will translate to today's race conditions. In other words, each past performance has been converted to give you actual expected times at each point of call for today's race if they ran that past race on today's race track, distance, and surface. Instead of comparing apples to oranges like you normally do with traditional past performances you now can compare apples to apples because all past performances have been converted to today's race conditions saving you time and giving you a higher level of accuracy in your handicapping which translates into more confidence in your selections and higher paying cashed tickets.
Finding Overlooked Horses Capable of Winning
 Often times a horse that may not have the ability to win a race will be a favorite due to it is coming off a win while another horse is overlooked on the tote board because it's last race was less than exceptional. One of the reasons this occurs is most people handicap with traditional past performances which don't always tell the whole story and often times important details have been left out which may suggest the overlooked horse may be more capable of winning in today's race conditions than the favorite.
To ensure we are comparing the most representative race for today's conditions Fractional Charting's expert handicappers watch all of the race replays for each horse and select the past performance that is most representative to today's race conditions. So in the case above the "favorite" may have just gotten lucky and had a good trip last time out while a race more representative to the horses true ability in today's conditions may have been 3 races back. Using our exclusive par-time-by-class standard that raw past performance is then adjusted to project the times for each point of call it is expected to earn in today's race.
Horses that are only 1 - 3 lengths back in the Fractional Charting often offer good value on the tote board which can lead to bigger payouts. The best way to quickly uncover hidden value and identify horses capable of winning in today's race is to identify any horse charting within one second (five lengths) of the chart-topper. These horses that are within one second of the fastest time should be considered capable of winning in today's race.
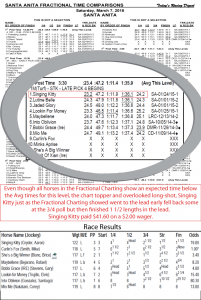
In the example Fractional Charting image on the right in the 8th Race at Santa Anita on March 7, even though all horses in the Fractional Charting show an expected time below the average times for this level, the chart-topper and overlooked long-shot, Singing Kitty (just as the Fractional Charting predicted) went to the lead early fell back some at the 3/4 poll but then finished 1 1/2 lengths in the lead. Singing Kitty paid $41.60 on a $2.00 wager.
Find Undervalued First-Time Starters
 Finding the likely winner or uncovering hidden value in Maiden races using traditional raw past performances can be challenging especially if there are first-time starters entered that have no past performances published. Fractional Charting makes it easy to quickly determine if you should be looking at first-time starters which often give much better payouts. When using Fractional Charting in Maiden races, if no horse charts close to par time for the level, then that's the time to give the new faces (first-time starters) a second look.
When looking at the example at the right in Race 9 at Aqueduct on April 24th you can compare the Average times at this level (listed at the top of the charting) to the chart topper (horse projected to win) we can see that Emily May Do It is projected to finish the race in 1:35.1 which is more than one second slower than the average final time 1:33.9 at this level. Since none of these horses chart close to the average finish time of today's race it might be a good time to look at a first time starter as a contender. In this case the results listed at the bottom of the image show first time starter Sambrook won the race and paid $18 to win. Sambrook was making her race debut as a 5 year old but she did come from a route winning dam.
Find Horses That Can Successfully Step Up in Class
 Often times the tote board will show false favorites while a less likely runner may be ready to step up. Often times this can happen due to cycle patterns that can be difficult to uncover when looking at just raw past performances. If you follow cycle patterns you understand that horses will often times regress after a big win only to come back faster and stronger after it has run a few more races and/or workouts. Because our expert handicappers are selecting the most representative past performance (the race/performance they feel the horse is capable of running today) and not just the fastest, best or most recent, like most handicappers do, you will now be able to uncover horses that may be coming off a down turn in their cycle patterns are ready to step up.
For each race, the par for the class for today's race conditions is listed in bold type above the race and is useful in determining which horses are a strong fit for the class. Simply compare the par times for today's race with each of the runner's and any runner that is not within 2 seconds (10 lengths) of the final par time should be considered capable of competing at this level. Any horse that is within one second (5 lengths) of the top horses' final time should be considered capable of winning.
In the Fractional Charting example on the right for the 2nd race at Santa Anita on March 8, Fame and Power was stepping up in class to a $56,000 Maiden Special Weight class in this race (from a 120 Race Class level to a 140 Race Class Level on Today’s Racing Digest’s Race Class Level Scale). After Fractional Charting normalized his last race to reflect today’s conditions it shows he can not only compete at this higher level but win. Which he did for a payout of $10.60. It should be noted that the actual race finish order was the same as what was in the Fractional Charting which would have paid out $99.20 on a $2.00 Superfecta.
Uncover the Swiftest Closers
 It has been said: “It is not how fast the horse runs that is important, but how the horse runs fast.” Compare this with how the other horses run fast in the same race and you will begin to understand the importance of pace in a race and suddenly it will become easier to pick better priced winners.
In longer races called routes, especially in turf routes, the ability of a horse to have a fast closing ability can make a lot of difference in how the race will be run. This especially becomes important when a race has multiple horses that like to be out in the lead (front runners) where a potential speed duel may occur. To find the swiftest closer using Fractional Charting just look in the 2nd to last column titled LF for Last Fraction and the time that is underlined is the quickest last fraction.
In the example Fractional Charting to the right, Delta Ranger has the quickest last fraction of 34.3 which indicates this horse has the ability to close faster in the final stretch than the other horses. Compare this with the other horses running and we see for those horses that have the ability to compete in this race and get an early lead will not be able to sustain that lead and will be overtaken down the stretch. Looking at the results that is exactly what happened with Indian Nate and Wicked Heat. In this race the Fractional Charting predicted the pace of the race along with the top 2 finishers in the exact same order.
Uncover Overlooked Long-Shots
 Fractional Charting is a great tool to quickly find horses that are contenders but may have been overlooked by the betting public. Typically, horses that are only 1 – 3 lengths back in the Fractional Charting often offer good value on the tote board which can lead to bigger payouts.
The best way to quickly uncover hidden value and identify horses capable of winning in a race is to identify any horse charting within one second (five lengths) of the chart-topper. These horses that are within one second of the fastest time should be considered capable of winning in today’s race.
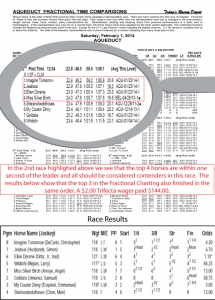
In the example on the left we show the 2nd race at Aqueduct on February 1. We can see that the top 4 horses are within one second of the leader and all should be considered contenders in this race. The results show that the top 3 in the Fractional Charting also finished the race in the same order. A $2.00 Trifecta wager on this race paid $144.00.
Get Out Of A Slump
 Fractional Charting is a good fit for those handicappers that have found themselves in a slump. Chasing lost wagers can often times get a handicapper into trouble by trying to quickly get back what they have lost by playing long-shots or other unreasonable exotic wagers only to dig themselves into a bigger hole. We have found that it might be wise to get back to basics and a good way to do that is only play horses that do very well in Fractional Charting.
Even if there isn’t much value in a race, Fractional Charting can help you put together tickets that will consistently get you winners. In the example to the left the top 4 listed in the Fractional Charting finished in the same order. This resulted in a $2 superfecta wager paying out $73.80.